
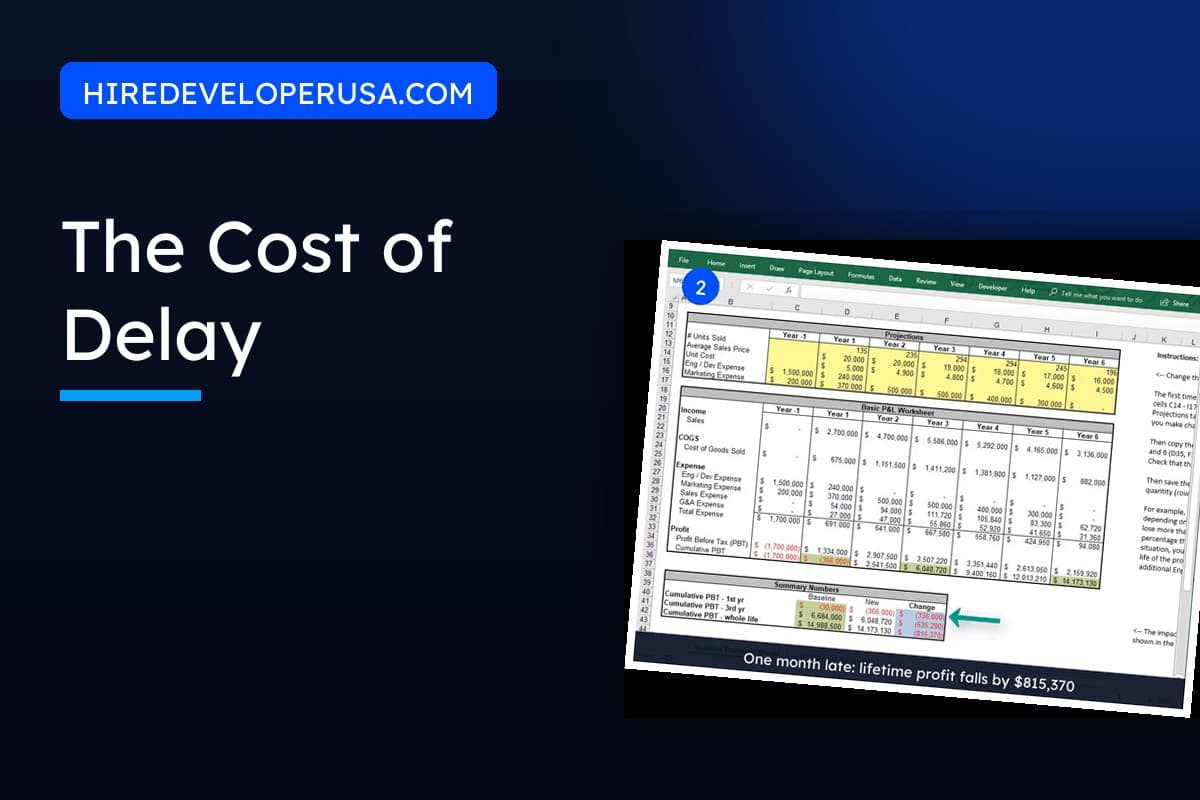
Key takeaways
- →Cost of delay is profit lost per unit of time, usually stated in dollars per month. It is a property of the product, not of the team working on it.
- →A one month slip costs far more than one month of sales: you pay an extra month of burn and then ramp to a lower curve for the rest of the product life.
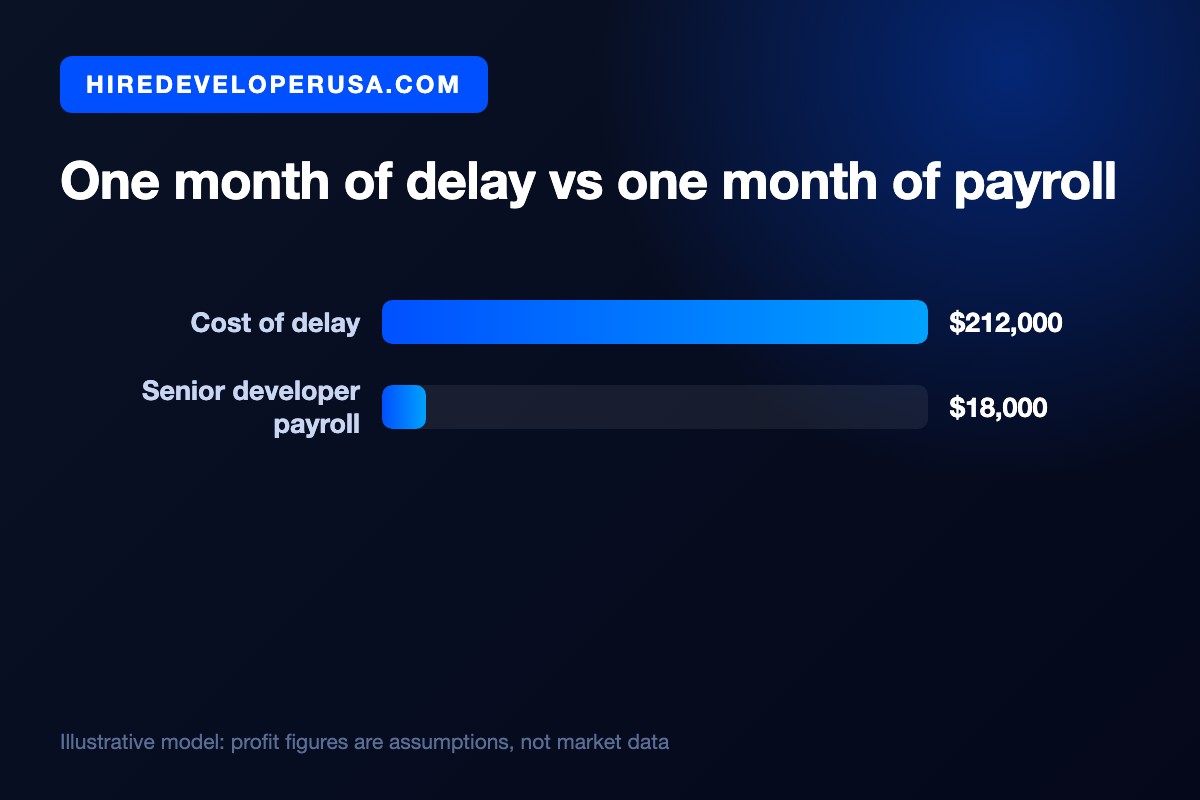
- →In the worked model here, one month late on a $3 million product line costs $212,000, roughly 7 percent of its lifetime profit.
- →The payroll you save by leaving a revenue-critical role open is about a twelfth of the delay you buy with it.
- →Compute the number once, keep it in version control, and use it to settle sequencing, expedite and scope decisions.
Cost of delay is the profit lost for each unit of time a project ships late. On most revenue-generating software work, that figure is far larger than the cost of the team building it. In the model below, a product line planned to clear $3 million in profit loses $212,000 to one month of slip, while the senior developer you did not hire that month would have cost about $18,000. That ratio (roughly twelve to one) explains why "let us keep looking" is often the most expensive sentence spoken in a hiring meeting. None of this is theory, which is the useful part. It is arithmetic, and an afternoon is enough to put a defensible number on your own roadmap.
Cost of delay, defined in one line
Cost of delay is the amount of profit you lose when something ships late, expressed as money per unit of time. The unit is almost always dollars per month. You would say it out loud like this: the cost of delay on the billing rebuild is $212,000 per month.
Two details in that sentence do the work. The first is profit, not revenue. Revenue makes the number look impressive and makes every decision it touches wrong, because a dollar of revenue you never earn costs you only the margin on it. The second is that the number belongs to the product, not to the team. Two squads of identical cost sitting on two different roadmap items can have costs of delay that differ by an order of magnitude, and that difference is the entire reason to compute it.
Most organizations have never run the calculation. Donald Reinertsen, whose work on product development economics is the usual reference point here, has reported that when he asked members of one team to estimate their cost of delay, their guesses varied by as much as fifty to one. That was not across companies. It was across people in the same room, working on the same product.
Without the number, whoever talks loudest settles three recurring arguments: which of two projects gives up a shared resource, whether it is worth paying extra to expedite, and whether to hold the date or cut the scope. Once you have it, all three turn into arithmetic.
Why one month late costs more than one month of sales
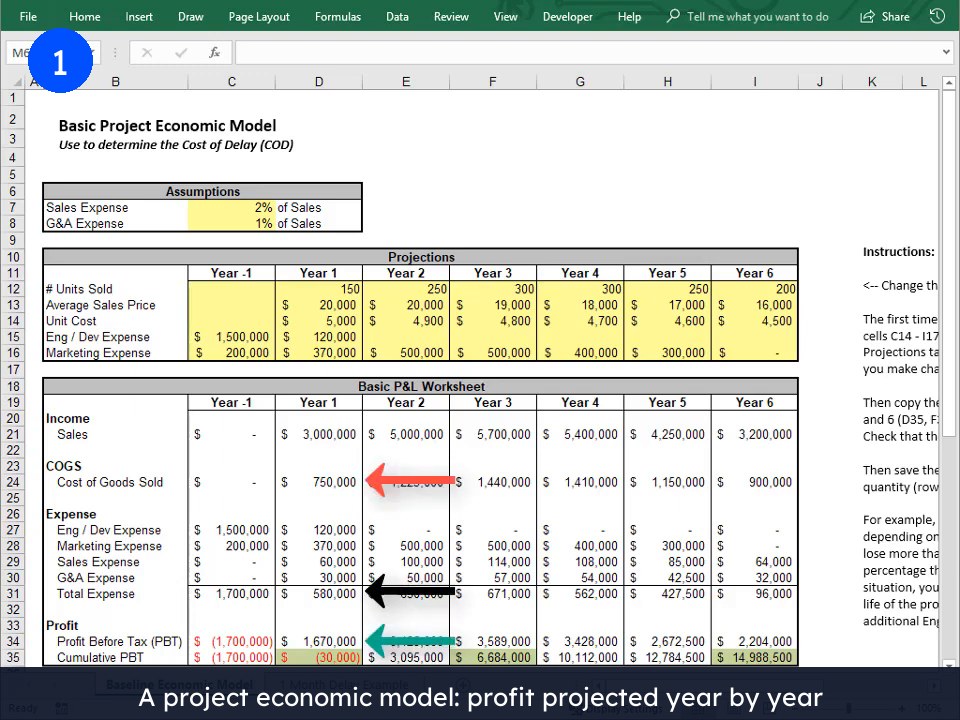
Intuitively, a one month delay just shifts the sales curve one month to the right, and you lose one month of sales at the end of the product life. That picture is comforting. It is also wrong, and this is the main reason cost of delay surprises people the first time they compute it.
Three things actually happen when a launch slips. You spend an extra month of team burn getting it out, and sometimes more than that if it turns into an all hands effort. You enter a market that has moved, so your ramp is shallower and your peak is lower than the plan assumed. And because the second curve never catches the first, you lose the gap between them for the entire remaining life of the product, not for one month.
What you lose is an area, not a slice. This explains why the most quoted finding in this literature, again from Reinertsen's research, is that a six month delay can cost roughly a third of a product's lifetime profit. Six months is nowhere near a third of a product's life. That third comes from the gap.
Internal software works by the same mechanism. If a platform migration slips two quarters, it does not cost two quarters of the savings it was meant to produce. It costs those two quarters plus every month of compounding pushed out behind them.
The arithmetic, line by line
Below is a worked model you can copy. Each figure in it is an assumption, picked to be round and conservative rather than realistic for any particular business. What matters is the shape of the calculation, not the digits.
Take a product line expected to clear $3 million of profit before tax over three years: $600,000 in year one, $1.1 million in year two, $1.3 million in year three. Then push the launch back by one month.
| Line | Planned | Erosion from a one month slip | Cost |
|---|---|---|---|
| Year 1 profit | $600,000 | 10% | $60,000 |
| Year 2 profit | $1,100,000 | 6% | $66,000 |
| Year 3 profit | $1,300,000 | 2% | $26,000 |
| Extra month of team burn | $60,000/month | one month | $60,000 |
| Cost of a one month delay | $3,000,000 | $212,000 |
The erosion column is the only genuinely editorial part, so it is where you should spend your argument. Ten percent in year one is a floor rather than a guess: one month is already 8.3 percent of the year, and unless you hold a monopoly you will not ramp back to plan, so anything under ten percent is optimistic. Six percent in year two and two percent in year three encode a market that gradually forgets you were late. The extra burn line is a squad of four at a fully loaded $60,000 per month working one more month, with no allowance for the marketing you may have to redo.
Total: $212,000, about 7 percent of the product's lifetime profit, bought with a single month. For anyone who has never put a number on the build itself, the companion piece on how to estimate software development costs covers the other half of this equation.

Scale it to your own product
Monthly figures are the convention. Weekly figures are what change behavior, because delay is actually bought in weeks: a week of interviewing, a week waiting on a contract, a week of a role sitting open while two people disagree about the offer.
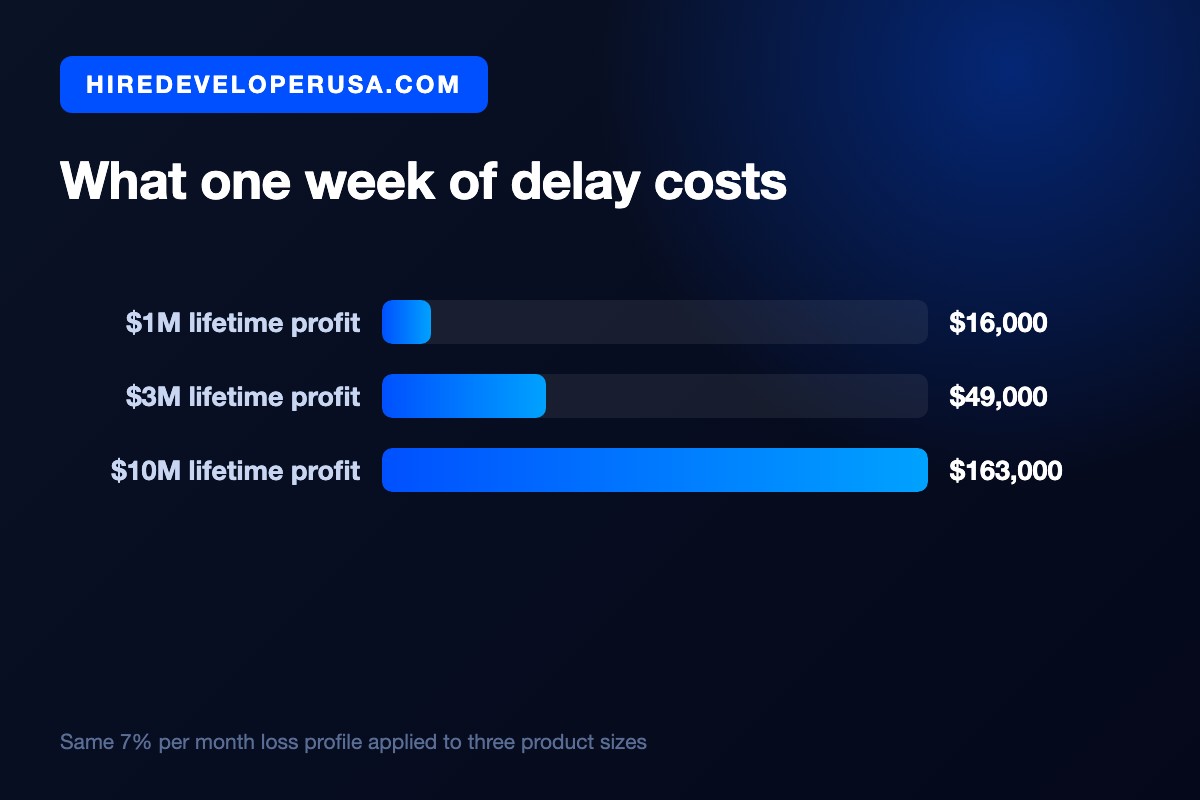
Divide $212,000 by the 4.33 weeks in an average month and the product line above is losing about $49,000 for every week it is late. Hold the same 7 percent per month loss profile and the number scales with the size of the product: about $16,000 a week on a product line worth $1 million in lifetime profit, and about $163,000 a week on one worth $10 million.
Look at the smallest of those. A modest product line, one you might not consider strategically important, is still losing $16,000 a week. A fully loaded senior developer costs roughly $4,000 for that same week. Every staffing conversation about that product is being held on the wrong side of a four to one ratio.
Put the model in code so it survives the next argument
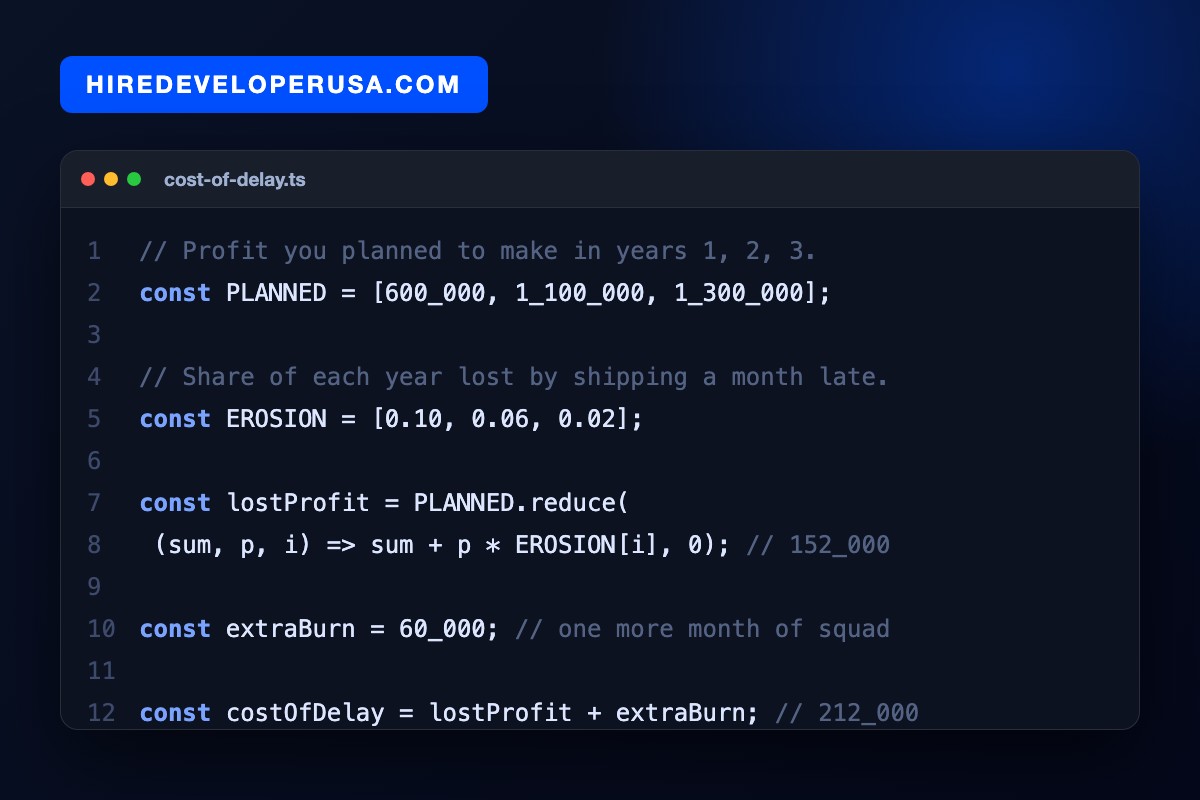
A spreadsheet is a fine place to build this and a poor place to keep it. Whoever opens it last owns the assumptions, there is no history of who changed the erosion rates, and the version that gets emailed around is never the version with the correction in it.
Twelve lines next to the roadmap fix that. Assumptions turn into named constants, any change to them needs a pull request, and the diff shows exactly which number someone wanted to move and why.
The interesting line is the erosion array. Finance, sales and engineering will legitimately disagree about it, and that disagreement is far better had in a code review than in the meeting where you decide whether to approve a contractor.
Why an open role is the most expensive delay you can buy
This is where the number earns its keep. On every report it shows up in, an unfilled position on a revenue project looks like a saving. Payroll is under budget. The headcount line is green. Nothing in the monthly accounts records the delay you bought with it.
Run the comparison on the model above. A fully loaded senior developer costs around $18,000 a month, while a month of delay on the product costs $212,000. Take a three month search, unremarkable for a senior backend role in most US markets: it saves $54,000 of payroll and buys $636,000 of delay. So the search is not free, and it never was. It was just invisible.
Two honest caveats apply. First, the argument holds only if the role sits genuinely on the critical path of revenue-generating work. If a role is not blocking anything, its cost of delay is close to zero, and in these terms filling it quickly is worth nothing. Before you quote the number at anyone, be ruthless about which kind you actually have. Second, a bad hire made quickly can carry its own cost of delay, so without a vetting process that holds, speed buys you nothing. Our notes on what it costs to hire software developers cover the other side of that ledger.
What the arithmetic does change is the price you should be willing to pay for speed. Paying fifteen percent above your band to start in two weeks instead of ten is, on these numbers, one of the cheapest decisions available to you. If the blocker is supply rather than budget, you can hire vetted full-stack developers on a timeline measured in days.
What to do with the number once you have it
Before acting on it, figure out what shape your delay has. The month by month model above assumes a steady market. Plenty of delay does not behave that way.
| Delay pattern | What it looks like | How to price it |
|---|---|---|
| Steady market | The curve shifts right and ramps lower | Profit lost per month, as modelled above |
| Hard window | A seasonal peak, an industry event, a regulatory date | Near zero before the date, then a cliff |
| Competitive race | A rival ships first and keeps the share | A permanent share loss across the whole life |
| Deferred saving | Internal work whose benefit has not started yet | The monthly saving, counted from the day it should have begun |
Then put it to use in three places. Order competing work by cost of delay divided by duration, so the short job that is expensive to delay goes first and nobody needs to relitigate it. Price expedite decisions against it, be that a contractor, a paid tool, or a weekend of someone's time. And if the date is genuinely immovable, let it tell you how much scope to cut; that conversation goes far better when both sides can see the number, and our guide to scoping an MVP is built for exactly that moment.
It also reframes cost cutting. Any saving that buys you time is not a saving until you have netted the delay off it, and a surprising number of them go negative once you do. That test belongs alongside the usual tactics for reducing software development costs.
Pick the single roadmap item that sits closest to revenue. Spend an afternoon with whoever owns the forecast, build the three year profit projection and run it twice, once on plan and once a month late. Divide the gap by four. The result is the price of each week you spend deciding, and it is almost certainly bigger than the hire you keep postponing.
Frequently asked questions
What is cost of delay in simple terms?
It is how much profit you lose for each unit of time a project is late, written as money per month. If the billing rebuild has a cost of delay of $212,000 per month, then every month it slips removes $212,000 of profit from the product's lifetime total. It is deliberately expressed in profit rather than revenue, because revenue overstates what a missed month actually costs you.
How do you calculate cost of delay?
Project the profit the product should earn in each year of its life, then redo the same projection with the launch a month later. Cut each year by the share of profit you expect to lose (heaviest in year one) and add one extra month of team burn. Your cost of delay for one month is the difference between the two lifetime totals. For a weekly figure, divide by 4.33.
Is cost of delay the same as the cost of an unfilled role?
No, but it is how you put a price on one. An unfilled role costs whatever the cost of delay is on the work it blocks, which is why the same vacancy can be nearly free on one team and very expensive on another. When the position is not holding up revenue-generating work, its cost of delay is close to zero and speed is worth little.
What if the project does not generate revenue directly?
Use the benefit it was going to deliver instead of sales. For internal platform work that is the monthly saving or the risk reduction, counted from the day it should have started rather than from the day the project ends. For compliance work driven by a fixed date, the shape changes: the cost is near zero until the deadline and then becomes a penalty, so model it as a cliff rather than a monthly rate.
Hire vetted talent